
Technical Analysis Stock Market
Here we are back at it again. This time we are back to find technical analysis on when to buy and sell. I have told you how the market condition is and what indicators you can use. And later, I told you where you could buy and sell, like an area you should consider selling or buying or where selling or buying pressure can come from before making a trade.
So on this post, I am going to go a bit further, naturally. This post will focus on two main factors for our technical analysis framework. The focus is on two E’s. The first letter, “E,” is Entry Trigger Point. The entry point for the graphs on where you can use detective to put the next trade-in. Another letter, “E,” is Exits. On exits, we will focus on two different categories. How to protect your trade and how to take profits (the fun part).
But with everything in life, before we start, let’s take a mini step back and recap a little bit for the first two-part of our technical analysis framework. If you remember correctly, the first part of our framework is M, as it is market structure.
Market structure is how you can define the condition of the market and how the market can hold on together. What I mean by holding on is using your naked eyes to check if the market is going towards an upward trend, a downward trend, or is the market in range. So you can check the market by looking with your naked eyes or can use candlestick patterns and moving averages to check the market conditions.
Secondly is the area of value. Where on your chart can be an area of value for you to buy or to sell. And where in your chart is the area of value, you can see that buying or selling pressure can step into the trade. So, the second part of the framework is not ready for trading. It is for you to know which area of the chart to trade.
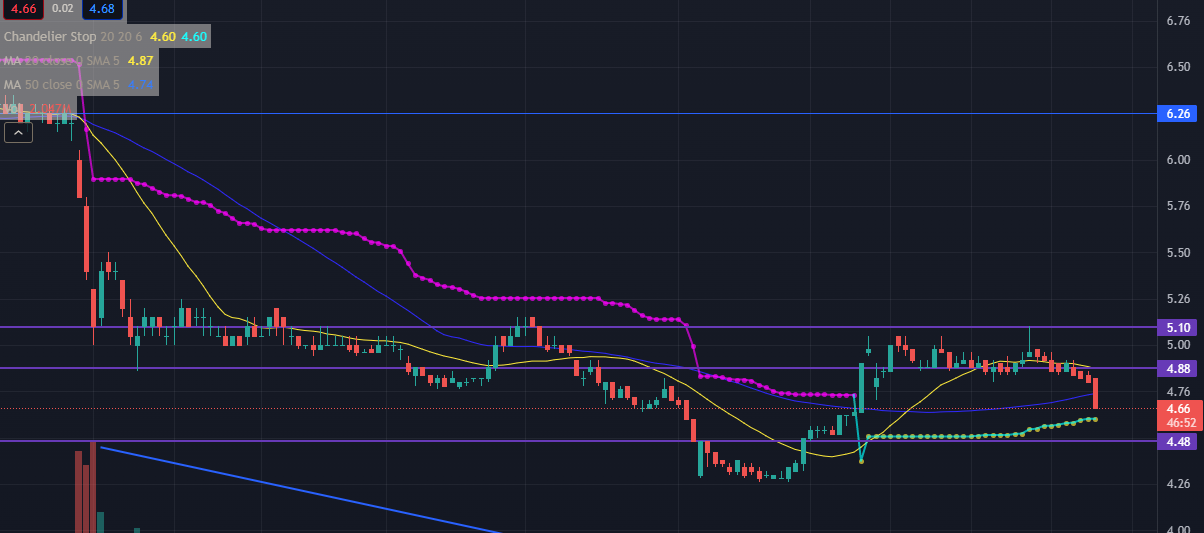
Of course, you can check your Area of value by drawing support and resistance lines to be an area, or you can use moving average indicators to study your AreaArea of value. The moving average will be a line to check the price action of each candlestick if the candlestick is respecting your moving average by touching the line 2 times or more.
So, that was a quick review of the first two-part of our technical analysis framework now. So, let’s continue and go along.
Third and First letter “E” is Entry Trigger Point. Finally, we are here. Entry Trigger Point is when exactly to buy or to sell your shares or trade. Entry trigger point uses simple price matters pattern to tell you when exactly to enter a trade. And they are a few ways to define entry trigger point. The ways to determine your entry trigger point are by candlestick patterns and moving average. Yes, we are here again, also similar and identical to the market structure. But with the entry trigger point, we are diving in a bit deeper with candlestick pattern and moving average as an indicator.
Candlestick Pattern
(Well, we first have to understand how to read a candlestick pattern. At first, I planned to have a separate post about candlestick patterns because they are a lot to write about candlestick patterns. So my plan now for the candlestick patterns is to write them simultaneously together and create a hyperlink. Wow, I find it to be fancy, but I did not want to be confused myself and also confused as many readers as I might even have. If more than I read this post, honestly, that is my audience already. ) Thank you, I will keep this part a bit short
So Candlestick Pattern:
One candlestick only, they are 4 price action math happening. The 4 data you see one 1 candlestick are the open price, close price, high of the day, and low. It does depend on the time frame you are choosing on your chart. So if your time frame is 4 hours, then one candlestick will read out, open price, close price, high of the 4 hours, and low of the 4 hours. And if it’s 15 minutes time frame, then 1 candlestick will readout as open price, close price, high of 15 minutes, and low of 15 minutes. And so on. And you can notice that only the high and low of 1certain time frame change, but the open and close price would not change but depends on the end of the day when the market closed, the effects of the closing price.
But there are so many candle shapes, and each candlestick has its purpose. Candlestick patterns, the body, and size have their purpose. If you continue reading the post, the next part might not make sense or feel like it’s continuous, but I will add a link to it.
Because to understand candlestick patterns, sometimes you need to remember that the shape and size are significant and have a purpose behind each candlestick. The patterns of each candlestick included have terms to them, but please do not just remember the words but look at the shape and size relative to the candlestick's body.
The patterns that I am talking about are like hammers shape candlestick. If you see a candle that looks hammer-like, someone is beating you even if the color is red or green; the purpose is rejection for lower prices. So by witnessing the hammer shape and some very observe hammer shape, you know the market is rejecting lower prices, so it is an excellent time to buy the shares. But that is not always the case. The market can go to a reversal, too, so you need a stop-loss, the next part of the trade.
Also, you can combine two candlestick patterns and see if the candlestick is in a good position. I mean by engulfing candlestick pattern. Engulfing candlestick patterns can be put into two categories: bearish engulfing patterns and bullish engulfing patterns. By reading the name, you can make a reasonable assumption that bullish is when buyers are in control, and you can see a few green candlesticks. The other side is a bearish candlestick pattern where the sellers control the market and might see more reads.
A bullish candlestick pattern is when you get two candlesticks and draw them up to make one candlestick and see how it goes. Another way to check if it is a bullish candlestick pattern is when the price of the latest candlestick closes above the previous candlestick pattern.
Bearish candlestick pattern is when you notice that the candlestick is like a shooting star. Not a hammer but a shooting star is when the candlestick's body is close behind the open price, and the closing price is almost at the lowest point of the candlestick. Is where the long thin is above the open price. Shooting Star is a term that rejects higher prices, meaning that a shooting star is when the market does not want the price to go up.
Pro tip: Remember to use candlestick pattern, not with isolation or to use the term, but to view it almost like an area. Because if the candlestick is green but showing a shooting star, it does not mean a trade but could mean that the market is rejecting higher prices, and the market can do a reversal.
So when is the time to trade then? Well, that is your decision to see when to trade, and you can use another technique to use the moving average for your trigger or entry point.
Moving Average: Entry Trigger Point
For this particular section of the entry, trigger point using moving average break. So we would be using moving average as an indicator but see when the price breaks from the moving average, so visit your entry point. So we called this moving average break.
For example, if the market is an uptrend and your moving average respects the swing and touches more than 2 candlesticks, you can see the AreaArea on which to trade. Now the fun part. How about starting to use the 5 day M.A. (Moving Average).
For the Area of value, I recommended using 50 days, 100 and 200 days,s, and even 20 M.A. to calculate the area of value on your chart. If the price is above 200, M.A. is a buying market below the selling market. If price touches and respect the 50 M.A. and candlesticks touch more than 2 times, that is a good area of value to start trading. If the price does not even touch the 50 days M.A., you can sell or stay away from the market. The same can be said about 20 day M.A., but it won’t have much depth for you to stay in the trade longer and miss out on the trend.
For the entry trigger point, we are going to use the 5 day M.A. Why five days because you understand and know how the market condition is at the present moment. Overall the M.A. for the entry point calculates your trade as a short-term trade or a long-term trade. A long-term trade is when the price breaks above the 5 days M.A. A short-term trade is when the price breaks below the 5 days M.A. So on your chart, you can set up the M.A. and do five days. So when the market tends to do a pullback to go higher, you can see the 5 day M.A. price next to the indicator and suggest trade on the next candlestick opens.
To better phrase it, a moving average break is meant to be used as the context for the market. Moving average break is intended to use as an overall picture of the market. As a trader, you must make a trading decision to stay in the market for a short term or a long term.
A pro tip again is when the price breaks above the 5 day M.A. period, it suggest buying the next candle to be in a long term trade at a good area of value and a reasonable price, as the market suggests it will do a pullback but in the long term trade. A long-term trade can take up to around 8-12 months.
Just a small and mini recap on the entry trigger point. Entry trigger point tells you as a trader when to buy or when to sell. Here I used the when frequently because entry trigger points tell you the direction and moment “when” to buy or sell your trade. You can use candlestick patterns and moving average breaks as an entry point trigger as well. Candlestick patterns can be easier to understand, but you know the technique. You can calculate beforehand when the price breaks above or below 5 days M.A. Thus, you can master the entry trigger point to become a profitable trader.
Next is the fun part and also, to be honest, the most downer part as well. The part is your exits. Exits for the trade come in two categories: to stop your losses (stop-loss) and profits when to take profits.
Exits
We have reached the final point for the strategy, and it's the best and the worst part. So now it's time to talk about when to exit the market or your trade. There are two types of exits. The first exit is where to exit if you are wrong (stop-loss). Second is your exit of where to take your profits (take profits). So yes, we are dividing our exits into two categories. Let's dig in then, my reader and readers.
Stop-loss: Exits
Exit number one or number uno, our first exits. Where do we exist if we are wrong? Your stop-loss should place at a level which invalidates your trading setup. So trade your stop-loss on how your trading view looks and matches with your time frame and your understanding. Further emphasis on your trading setup, such as the trend market, and your support and resistance line (AreaArea) is drawn on the chart. An indicator as we are reading on technical analysis trading strategy. The indicator on your chart to use is the Average True Range (A.T.R.).
We use the A.T.R. I will explain in a bit what the A.T.R. indicator is; hold on, we are going home. Your stop-loss should be set as 1 A.T.R. beyond your AreaArea of value. Use 20 days A.T.R. as it can give more depth to your trade and give some further analysis. Average True Range (A.T.R.) indicates the volatility of the market. The volatility of the market is calculating the price change of the market. It just checks volatility, such as how high and low price ranges at your setup. Such as the 20-day set up so that the actual average range will calculate the changes in the price range. A.T.R. indicates to traders how much price moves in a given period of days. If the price moves a considerable percentage, it shows that the volatility is high. High volatility means that prices have higher highs and lower lows frequently. The market is risky, but it depends on how you are trading as well. If the A.T.R. percentage is low, it indicates volatility is low. Meaning that the price is given for days does not have much higher highs and lower lows much but as the market is in range.
A critical tip and note, though, A.T.R. does not measure the trend but the volatility of how much price moves in a given period of days. Y
You can use the A.T.R. value and look at candlestick patterns and shapes. If the A.T.R. line is in a high curve and the candlestick body is quite extensive, buying pressure is stepping in and pushing the price up. On the other hand, if the A.T.R. line curve is heading down and the candlestick body is a bit small, the market could be heading towards a downtrend.
Take a breather as now it's time to set up your stop-loss. As you saw, the market structure is going towards an uptrend. You want to be a buyer in the market and want to ride the trend. You look at the chart and see that the candlesticks and swing points respect the MA 50 by touching it more than twice. You have seen some latest swing points on your chart, and now, where is a good area of value to draw your support and resistance line. Such lines to know and predict where buying pressure can step in or where selling pressure can step in and break your support and resistance. The AreaArea of value is important to note where on your chart you want to trade. Now you reach the point or when to enter the market. So, you saw some candlestick bars price break and close above MA 50 for a longer trend. Secondly, by reading candlestick patterns, you notice that they can be a bullish reversal such as hammer, or engulfing bullish hammer by combine 2 hours 4 hour and 8-hour time frame. With that, you can enter at the next bar open or the next day.
Apologies for dragging on through my readers and myself, but I also feel these recaps are essential to me as a novice trader and maybe for my readers who are novice traders and want to understand the concept of trading.
So now we reach to step-up stop-loss. So you know the price you want to enter on the next bar open or next day. So the cost of the market and you can get the A.T.R. percentage, and you subtract it, as a trending market you want to be a buyer, and what the number is, will be your stop-loss value.
Price A.T.O. - ATR= Stop-loss
If you are trading downward and looking for selling opportunities, you add your A.T.R.
Pro tip: The A.T.R. multiple can adjust to your needs and can decide on the use of your trading setup.
Take Profits
We have arrived at the exciting part is when to take profits. When the market moves in your favor, so when do you want to take profits. We can divide it up into 2 approaches: swing trading and trending trading. By the way, you can try many more ways and methods, but for now, we use the swing and trend approach as to how we are analyzing the market by analyzing trends and price action.
We will go ahead and start with both kinds of approaches on how to take profits. Then, you can try both ways on how to trade, and later on, you can find your optimal trade approach on how to take profits or go short, medium, or long.
Swing Trading
As the name might have suggested already, swing trading is to capture one big move. You want to capture the big trend going upwards and a giant swing up. To capture the big swing move is to exit your trade before oppressing traders come and cut the swing. Basically, on the uptrend, and you are a buyer for the market, you want to capture the swing before it hit your resistance or when it just has broken from your resistance. You want to take profits before it hits your resistance or breaks it as the market might cause a reversal, and your trade can go down.
They are two sides to the coin, and they are some pros and cons of being a swing trader. The pros of being a swing trader are a high winning rate, which should be increased as you are waiting to capture one big move before opposing pressure can step in and cause a market reversal.
The cons of swing trading are that you are not riding the trend for a long way as you are following your pre-determine profits and stop-loss analysis before the market can cause a reversal.
Trend Trading
Trend trading is riding the market trend but not capturing one big move of the market. You want to catch the waves of the market and not the trend as much, but the waves of the market going up and down. To capture trending trading moves, you will need to add trailing stop-loss to your order, or you can catch the profits by looking at the M.A. You are following the market trend. Still, a positive note is that how much of the trend you want to capture depends on the time frame and how your trading setup looks like on your chart.
Short-term trend: your trailing stop loss to take profits is to capture when the prices close below 20 days M.A.
Medium-term trend: your trailing stop-loss to take profits is captured when the prices close below 50 days M.A.
Long-term trend: your trailing stop-loss is to take profits is to capture when the prices close below 100 days M.A.
Of course, they are two sides to the coin of everything. One some the pros of trend trading are that you are riding the trend of the market. The con is that you might have a low winning rate, as you are following your trailing stop-loss and riding along with your trend.
A bit of recap on pretty much everything on technical analysis and M.A.E.E. strategy.
- Market structure: uptrend, downtrend, range markets. Want to trade in the direction of trends depending on your trade.
- Area of value: Support and Resistance and Moving Average to see where on the chart is a good area of importance to trade.
- As market could be over brought, trade from Area of value
- If the market is on an uptrend, want to trade near the support or find a good area of value to enter near the support line.
- Entry Trigger Point: candlestick patterns and moving average break
- When to trade, the price point to start selling.
- To time your entry price point to trade
- Specific price patterns to start trading
- Exits: stop-loss and to take profits
- Swing trading
- Trend trading
So, in essence, technical analysis is to trade with the trend of the market. First, you understand what the market is saying to you and how the market is looking on your chart. Then you find your AreaArea of value on the chart by drawing up support and resistance line or by finding out with moving average tests. Then you find your entry point by reading candlestick patterns and looking out of moving average breakpoints. Lastly, you need to have a bit of risk management and point the way to protect your trade with stop-loss and honestly not to get too greedy and know when to take profits before the market goes into a reversal.